Multimedia
a collection of files, images and moviesMovies:
(click on the image to download)
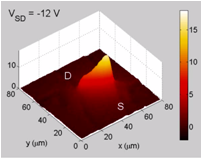
This movie shows real-time heating observed in a large (25x6 um) graphene transistor using infrared (IR) thermal microscopy. The spatial resolution is ~2 um and the temperature resolution is ~0.1 C. The drain-source voltage is varied from -12 to 12 V, illustrating the movement of the hot spot between electrodes. The background temperature is 70 C, and the vertical color bar is the temperature rise above this, in C. [500 kb wmv file]

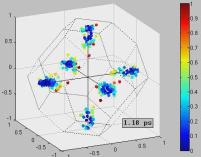
This movie shows electron trajectories in momentum space. The Brillouin zone boundaries are drawn with dotted lines and the camera angle begins to change after 1.25 ps. The applied electric field is zero for the first 0.5 ps and -40 kV/cm thereafter. Note that the negatively charged electrons are accelerated in the +x direction, against the electric field. The vertical color bar is the electron energy scale, in eV. [2.7 Mb mpg file]
 This
movie shows electron trajectories in real space, inside an 18 nm
ultra-thin body (UTB) silicon-on-insulator (SOI) transistor. The
applied voltage is 0.8 V on the gate and drain, the source (left) is
grounded. The device was optimized (Ion=1000 uA/um and
Ioff=1 uA/um) with the help of a commercial device simulator
(Medici).
The
particle trajectories were then computed with Monet
in the fixed field
distribution extracted from Medici. The vertical color bar is
the
electron energy scale, in eV. [9.9 Mb mpg file]
Data:

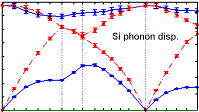
The phonon dispersion data in bulk silicon from G. Dolling's 1963 paper ("Lattice Vibrations in Crystals with the Diamond Structure"). The plot on the left can be obtained with this Matlab file.
Note: these files are for public and educational use. If you use them, drop Prof. Pop an email (epop @ ...). Please mention the source as this website, poplab.stanford.edu.
updated July 2013